Synthetic Runoff Testing Biologically Enhanced Practices
A.J. Erickson, B.C. Asleson, J.S. Gulliver, R.M. Hozalski
Synthetic runoff testing (level 3) involves the application of synthetic stormwater runoff to assess stormwater infiltration rate, pollutant removal efficiency, or both. The reductions in peak flow and runoff volume can be estimated from the infiltration rate, specified storm intensity and duration, and watershed characteristics. Synthetic runoff testing can be applied to bioretention, constructed wetlands, filter strips, and swales (provided adequate access and water supply is available).
Bioretention practices (rain gardens)
Synthetic runoff testing of bioretention practices to determine the drain time involves filling the bioretention practice with synthetic stormwater and measuring the change in head (i.e., water level) with respect to time. The flow rate of the water source (e.g., fire hydrant, water truck) should be significantly greater than the rate water infiltrates into the soil so that the bioretention practice can be filled to the design storm volume in less than one hour. If, however, the flow rate of the water source is not sufficient to fill the bioretention practice in a reasonable amount of time, pollutant removal efficiency can still be determined. In this case, it can be assumed that the infiltration rate (units = length/time) is equal to or greater than the water source discharge rate (units = volume/time) divided by the infiltration area. This process is described in more detail in Asleson et al. (2009).
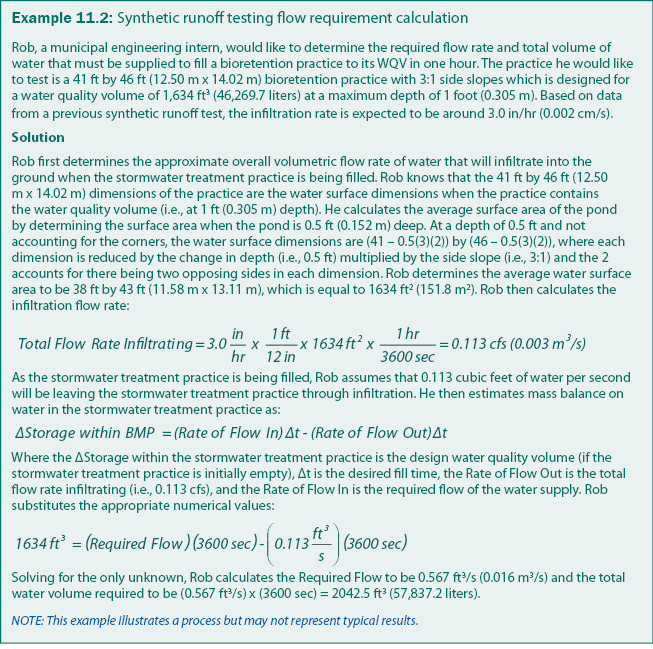
Determination of the required flow rate and total volume of water for synthetic runoff testing is demonstrated in example 11.2. In order to determine the flow rate and volume of water needed for synthetic runoff testing (level 3), an estimate of the infiltration rate is needed. Infiltration rates are best determined from hydraulic conductivity tests (level 2) but can be estimated from other relevant information about the practice (e.g., soil type, surface characteristics). Typical saturated hydraulic conductivities for unconsolidated sediments, which can be used to approximate infiltration rates, range from 30–3000 ft/day (0.01 to 1 cm/s) for well-sorted gravels, to 0.3–0.003 ft/day (10-4 to 10-6 cm/s) for silt, sandy silts, clayey sands, and till (Fetter 2001).
The relationship between total infiltration discharge (cfs) and stormwater treatment surface area (ft2) for various infiltration rates (in/hr) is shown in figure 11.5. The relationship between the required synthetic runoff flow rate (cfs) and the infiltration discharge for various ratios of water quality volume (ft3) and desired fill time (hr) is shown in figure 11.6. Figures 11.5 and 11.6 can be used together to estimate the required water supply flow rate for synthetic runoff.
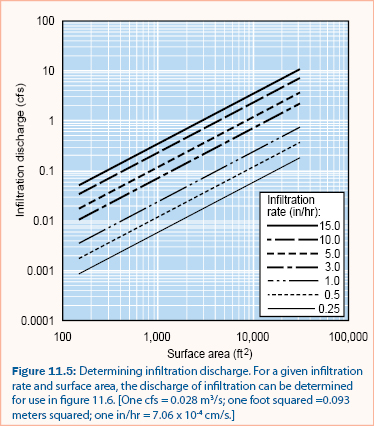
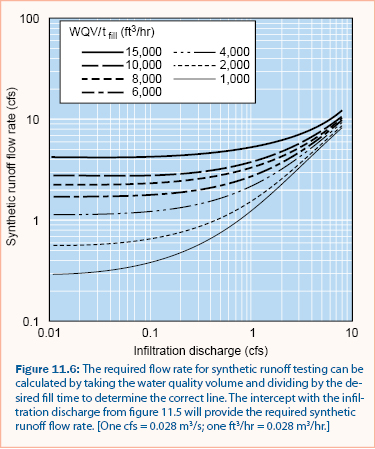
Example 11.2 can also be solved using figures 11.5 and 11.6. From figure 11.5, a bioretention practice with an estimated infiltration rate of 3.0 in/hr (0.002 cm/s) and a surface area of 1634 ft2 (151.8 m2) will infiltrate approximately 0.11 cfs (0.003 m3/s). From figure 11.6, an infiltration discharge of 0.11 cfs and a water volume to desired fill time ratio of 1,634 ft3/hr (i.e., WQV/tfill = 3,864 ft3/1.0 hr) would require a synthetic runoff flow rate of approximately 0.5 cfs (0.014 m3/s). For comparison, a typical fire hydrant can produce between 2 and 4 cfs (0.057–0.113 m3/s) for up to approximately 30 minutes. If the water supply used for synthetic runoff testing cannot produce the required flow, the fill time may need to be increased or the flow augmented (i.e., pump truck or multiple hydrants). The total volume of water required can be determined as shown in the last calculation of example 11.2. The total volume of water required must not exceed the limitations of the available water source. Finally, the amount of time required to fill the stormwater treatment practice can be calculated from a given water supply flow rate.
The measured drain time for the rain garden should be compared to design specifications to determine if the rain garden is performing effectively. The drain time should be measured periodically to determine if the rain garden performance is stable or decreasing significantly.
The pollutant removal efficiency of a bioretention practice can be estimated by adding a pollutant (e.g., sediment or phosphorus) to the synthetic stormwater, collecting effluent samples over time, and measuring the concentration of pollutant in the effluent samples. The accuracy of these tests is limited by difficulties in achieving a representative pollutant concentration through sampling (see Automatic sampling suspended solids for more information). After infiltration through the soil, however, the size distribution of the remaining suspended solids may be below the problematic range. Erosion control must be considered prior to synthetic runoff testing of a bioretention practice. Inflow structures (i.e., curb cut or storm sewer outlet) should be used when available and appropriate to reduce erosion while simulating a runoff event. Sandbags, rocks, or other flow dissipation devices should be used to prevent erosion of the soil and vegetation.
As discussed in Developing an Assessment Program, synthetic runoff testing (level 3) requires more ‘relative effort’ than capacity testing (level 2) for most stormwater treatment practices. For bioretention practices, however, it might require less relative effort to perform synthetic runoff testing (level 3) than capacity testing (level 2) as long as a sufficient water source is available. In other words, in many cases it may be easier and less time consuming to fill a bioretention practice with synthetic runoff and measure the change in water level (i.e., ponded depth) with respect to time than to perform multiple point infiltration measurements.
The results of capacity testing (level 2) of a bioretention practice will, however, produce more specific information than synthetic runoff testing (level 3) because capacity testing can be used to guide localized maintenance within a bioretention practice. For example, synthetic runoff testing of a bioretention practice may indicate that the practice is able to drain a synthetic storm event that is equivalent to the water quality volume in less than 24 hours and is therefore functioning as designed. capacity testing (level 2), however, may indicate that 40% of the bioretention practice is not infiltrating water and the remaining 60% is infiltrating water faster than the overall average infiltration rate determined from the synthetic runoff test. Furthermore, capacity testing would indicate where in the bioretention practice the minimal or small hydraulic conductivity areas are located. The organization that is responsible for maintenance of the bioretention practice can then conduct localized maintenance on the areas that are clogged to rejuvenate the practice to design conditions before the entire bioretention practice fails.
Constructed wetlands
Synthetic runoff testing of constructed wetlands can be used to estimate the pollutant removal efficiency by adding a pollutant (e.g., sediment or phosphorus) to the synthetic stormwater and then measuring the concentration of pollutant exiting the wetland. The accuracy of these tests is limited by challenges in achieving a representative pollutant concentration through sampling, which depends upon the size distribution of inorganic solids in the outflow (see Automatic sampling suspended solids).
Synthetic runoff tests using a conservative tracer (e.g., chloride, rhodamine, etc.) can be used to investigate the hydraulic behavior of a wetland. These studies involve adding a tracer to the influent and measuring the tracer concentration in the effluent as a function of time during a synthetic runoff event. Results from tracer studies can be used to determine if stormwater is short circuiting through the wetland, if there are dead zones that do not participate in significant pollutant removal, or if the stormwater wetland is operating as designed. Short circuiting is a significant problem that may result in poor pollutant removal efficiency because pollutant removal efficiency is typically proportional to residence time in the system. An example of using a tracer study to determine the hydraulic characteristics of a wet pond is given in Sedimentation Practices, example 10.2). The same procedure would be followed in a constructed wetland, with the appropriate tracer.
Filter strips and swales
Synthetic runoff testing is not recommended for filter strips or swales because these stormwater treatment practices typically lack the inlet and outlet flow structures that would allow for discharge measurement (as described in Water Budget Measurement) or pollutant sampling (as described in Sampling Methods).
Continue to Monitoring.