
Number of storm events
P.T. Weiss, A.J. Erickson, J.S. Gulliver, R.M. Hozalski, O. Mohseni, and W.R. Herb
The most important sampling consideration in an assessment program is the number of storm events to be sampled. The number of storm events sampled and the variance in the results from those storm events will determine the assessment uncertainty. Assessment uncertainty needs to be controlled so that comparisons to other stormwater treatment practices, comparisons to past assessment, predictions of future performance for TMDL calculations, and maintenance scheduling are accurate and reliable. For example, suppose the event mean concentration for a specific pollutant during a storm was reduced from an influent value of 100 mg/L to an effluent value of 40 mg/L in a stormwater treatment practice. It cannot be assumed that the stormwater treatment practice reduces the event mean concentration by 60% for all storm events. Several storm events, representing a range of conditions (i.e., flow rate and pollutant concentration), need to be sampled and analyzed before predictions of treatment practice performance can be made. The rest of this section describes a process that can be used to select an appropriate range of assessment uncertainty, and subsequently determine the number of storm events that should be sampled.
To simplify the statistical analysis, several assumptions can be made. One assumption is that the percent removal data are normally distributed about a mean value and that one storm event does not influence another. Another assumption is that there is no storm event bias (systematic uncertainty) in percent removal. Finally, the number of storms required will likely be fewer than 30 and the actual variance in the data is unknown, therefore the Student (Gosset) t-distribution is used. The Student (Gosset) t-distribution is a probability distribution used to estimate the mean of a normally distributed population from a sample of the population and is more accurate for small (n < 30) sample sizes than the similar z-distribution. For more information on distributions, consult a statistics text (e.g., MacBerthouex and Brown 1996, Moore and McCabe 2003).

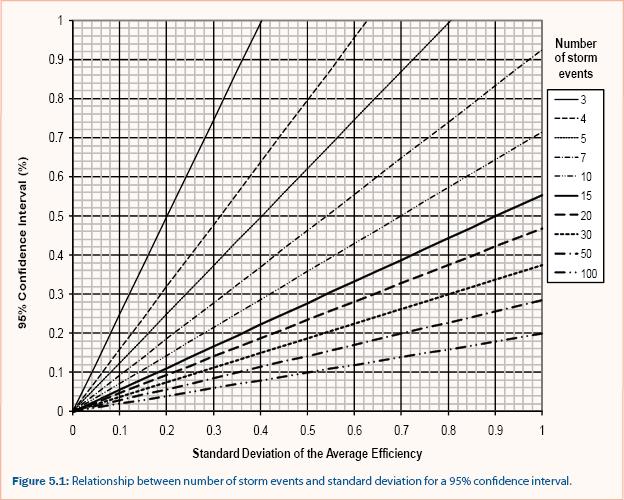
The 95% confidence interval is recommended to adequately represent uncertainty in average pollutant removal efficiency because it indicates that there is a 95% probability that the actual average performance will be within the confidence interval. For example, a stormwater treatment practice with an average pollutant capture rate of 72% ± 17% confidence interval (α = 0.05) will have a 95% (19 out of 20) probability that the actual average pollutant capture rate is between 55% and 89%. The range of the confidence interval (in this case, ± 17% for α = 0.05) is dependent on the standard deviation and the number of monitored storm events. The relationship between standard deviation, number of storm events, and 95% confidence interval is shown in figure 5.1.
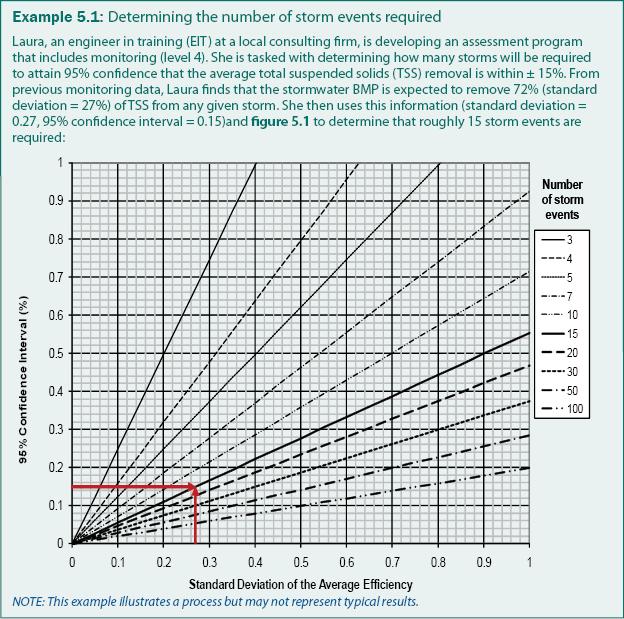
The process for determining the number of storm events can be performed in three steps as illustrated in example 5.1. This process should be performed during development of an assessment program to estimate the cost and effort associated with sampling multiple storm events based on the estimated uncertainty. As assessment results are gathered, this process should be performed again using actual assessment data to determine the actual uncertainty.
- Compute the standard deviation of the percent removal values for storm events that have been sampled. If there are no storm event data, select a standard deviation; typical standard deviations for percent removal of stormwater treatment practices range from 20% to 40% (Weiss et al. 2005).
- Select the desired range of the 95% confidence interval for the mean removal over all storms (10 to 15% is recommended).
- Using the standard deviation (step 1) and the confidence interval (step 2), estimate the number of storm events required to achieve the desired range for the 95% confidence interval of the mean removal over all storms from figure 5.1.
Continue to Samples per storm events.