
Synthetic Runoff Testing Filtration Practices
A.J. Erickson, J.S. Gulliver, R.M. Hozalski, P.T. Weiss
Synthetic runoff testing (level 3) can be used to measure the filtration rate of filtration practices if the available water supply can provide a sufficient water volume and discharge: fire hydrants can typically produce between 2 and 4 cfs for up to approximately 30 minutes and a water truck can produce up to approximately 1 cfs (0.028 m3/s). Most commercial water trucks hold approximately 500 ft3 (14,160 liters) of water, but a large water truck can hold up to 1000 ft3 (28,320 liters), allowing the maximum discharge for approximately 20 minutes.
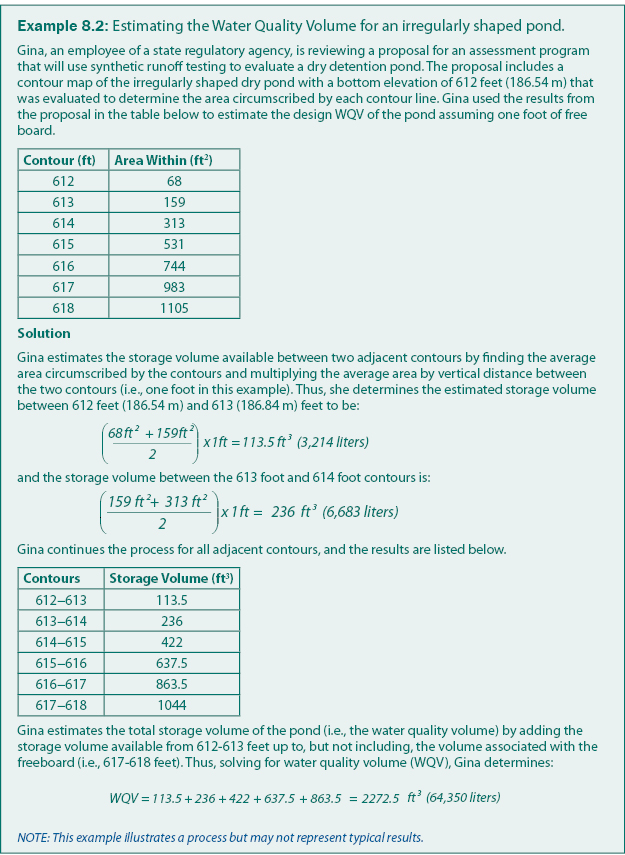
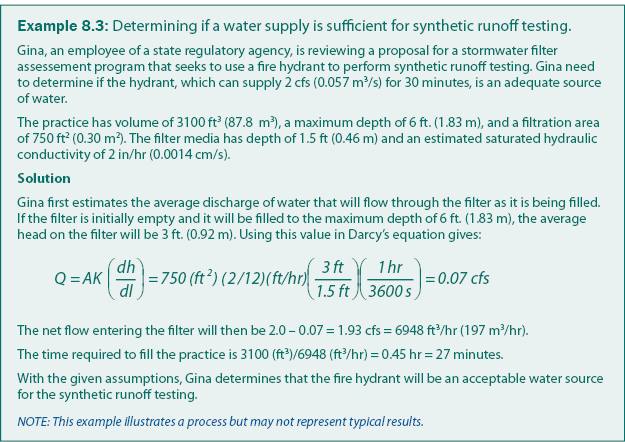
Given accurate contours, drafting software such as AutoCAD can be used to calculate the volume of a stormwater filter, or the volume can be approximated as shown in example 8.2. If the practice is initially empty, the volume of water required is the volume of the stormwater filter plus the estimated volume of water that will pass through the filter while the practice is being filled. Also, the water supply must provide a discharge that can fill the practice in an acceptable amount of time (i.e. 1 hour). The process of determining if a water supply is adequate is demonstrated in example 8.3.
Synthetic runoff tests can be used to detect the presence of macropores within a filtration practice. Sand filtration design recommends a saturated hydraulic conductivity (k) of 3.5 ft/day (1.07 m/day) (Claytor and Schueler 1996, Minnesota Stormwater Manual). If the results from the synthetic runoff tests indicate that the hydraulic conductivity for the filtration practice is larger than 280 ft/day (85.34 m/day), macropores may be reducing the sieving process and thus reducing solids removal efficiency. Filtration rates less than 280 ft/day do not preclude the presence of macropores, but indicate that the amount of macropores is not necessarily significant.
For filtration practices, synthetic runoff testing (level 3) may require the same or less effort than capacity testing (level 2). In other words, it may be easier and require less time to fill a filtration practice and measure the change in water level (i.e., ponded depth) with respect to time than to perform multiple point infiltration measurements, as long as the water supply is sufficient. This is especially true of underground filtration practices, which are typically small systems that have limited access. The results of capacity testing and synthetic runoff testing will differ, however, for filtration practices.
The results of capacity testing for a filtration practice will produce more specific information than synthetic runoff testing will and can be used to guide localized maintenance within a filtration practice. For example, synthetic runoff testing of a filtration practice may indicate that the practice is able to drain a synthetic storm event that is equivalent to the water quality volume in less than 48 hours and is therefore functioning as designed. Capacity testing, however, may indicate that 25% of the filtration practice is not filtering water at all and the remaining 75% is filtering all of the incoming stormwater water. Furthermore, capacity testing can indicate where malfunction is occurring in the filtration practice, which allows for localized maintenance to restore the practice to design conditions before the entire filtration practice fails.
Continue to Monitoring.