
Case Study #7: Monitoring to test the P8 model at Bass Creek Business Park
Brian Vlach and John Barten at Three Rivers Park District.
Introduction
The planning of a commercial development requires the implementation of best management practices to minimize runoff volume and nutrient loading. The particular management approach selected is often determined through modeling efforts. The proposed site plan is often modeled to determine the changes in runoff volume and nutrient loading. The model is re-run with different best management scenarios based on standard design criteria for the particular change in land use. However, the performance of best management practices implemented to correspond with a particular change in land use may not adequately reflect modeling efforts. Consequently, the preliminary modeling efforts may inaccurately predict the actual water volume and nutrient loading budgets for the proposed site development. In addition, monitoring efforts are rarely incorporated after completion of the development to determine whether best management practices were effective in reducing runoff volume and nutrient loading. There appears to be insufficient monitoring data to substantiate whether proposed best management practices are effective in reducing runoff volume and nutrient loading.
The Three Rivers Park District monitored the performance of a three-celled nutrient detention pond that was designed to reduce run-off volume and nutrient loading from a commercial development (Bass Creek Business Park) in the City of Plymouth. The water flows from the three-cell treatment pond to a wetland before discharging to Pike Lake. There have been numerous water quality models (e.g. P8, DETPOND) suggesting that multiple cell detention basins are more efficient at nutrient and sediment removal than single-cell ponds particularly when followed by wetland treatment. The Bass Creek Business Park was monitored to test the validity of the P8 model predictions.
Study Site
The Bass Creek Business Park is located west of Highway 169 on Bass Lake Road along the northern border of the City of Plymouth. The watershed is approximately 76 acres that were primarily developed as commercial/industrial land use from 1996 through 1998 (Table 1; Figure 1). The three-celled nutrient detention pond receives runoff from 42 acres of commercial/industrial land use. A monitoring station (TP1) was located at the discharge point of the commercial/industrial area prior to draining to the first cell of the three-cell treatment pond. The three-celled nutrient detention pond discharges into a 5-acre wetland. A second monitoring station (TP2) was located at the outlet of the three-cell treatment pond that drains to the wetland. The wetland was to provide additional treatment prior to flowing to Pike Lake. Consequently, a third monitoring station (TP3) was located down stream of the wetland outlet prior to draining to Pike Lake.

Methods
Three Rivers Park District monitored each sampling site from 2004 through 2005. At each of the sampling sites, an automated sampler/flow data logger was installed to monitor continuous flow measurements from May through October. The data logger recorded changes in level, velocity, and flow at 1-minute intervals. The flow data loggers were programmed to initiate sample collection after a predetermined increase in water level was obtained. After sampling was initiated, flow-weighted composite water samples were sequentially collected to encompass the entire storm distribution. The anticipated storm events were based upon estimated precipitation volume. A tipping bucket rain gauge was installed at the TP2 sampling site to measure the actual amount of precipitation at 1-minute intervals. After each precipitation event, the water quality samples were collected within 24-hours. During extended periods without precipitation, grab samples were collected to determine nutrient concentrations during base flow conditions. All samples were labeled immediately after collection, stored in a cooler with ice, and delivered to the Three Rivers Park District for laboratory analysis. During each site visit, flow meter data was downloaded by a field laptop computer.
Three Rivers Park District analyzed each water quality sample for nutrient content. The water quality samples were analyzed for total phosphorus, soluble reactive phosphorus, total nitrogen, and total suspended solids. The Standard Methods for the Examination of Water and Wastewater (1995) was used to determine nutrient concentrations of the water samples. Sample analysis was prioritized by analyte holding time to ensure that analyses were completed within the recommended time interval. Samples were stored at 4° C in a refrigerator until all analysis was completed. A quality assurance and quality control protocol was followed to ensure the precision and accuracy of laboratory data analysis.
The flow meter data and water quality data were used to determine the nutrient loading for each monitoring site. The nutrient loading for each storm event was calculated by multiplying the flow volume and nutrient concentration. The monitoring data was used to calibrate a P8 model developed for the Bass Creek Business Park. The P8 model was calibrated to mimic similar flow and nutrient loading conditions that were observed during the sampling interval. The model was only calibrated with flow and nutrient concentration data that was considered reliable. There were time periods when flow or nutrient concentration information was missing for a particular storm event. The calibrated model was used to estimate the flow or nutrient concentration when data was missing. The nutrient loading was used to estimate the removal efficiency for the three-celled treatment pond and the wetland. The removal efficiency for the treatment devices were calculated using a mass balance equation. The nutrient loading and % removal efficiencies were compared to values estimated by the calibrated P8 model. The details pertaining to model calibration are further described in the following section.
Model Calibration
The P8 model was developed to assess nutrient removal efficiency of a three-cell NURP pond treatment device for the Bass Creek Business Park watershed. The same P8 model configuration was used to assess and compare performance of a single-cell NURP pond. The parameters entered into the model included the pervious and impervious sub-watershed characteristics (Table 1). The parameters corresponding to each treatment device included the morphological characteristics for each pond within the three-cell configuration as well as for the downstream wetland (Table 2). The rainfall data collected hourly at the monitoring site were used for model application, and a daily average temperature file was also developed from data collected at Crystal Airport in 2005. The flow network diagram further describes how the P8 model was set-up for the Bass Creek Business Park (Figure 2).


The model was initially calibrated using flow data collected at each monitoring site. The TP1 monitoring site received direct run-off from the Bass Creek Business Park watershed, and directly flowed into the first cell of three-cell NURP pond treatment device. The TP2 monitoring site received water from the third cell of the three-cell NURP treatment device, and outleted directly into the wetland treatment device. The TP3 monitoring site received water from the wetland treatment device, which ultimately drains to Pike Lake. Model adjustments were made so that the predicted total flow volume was similar to the observed total flow volume at each monitoring site. When there was reliable flow information at a particular monitoring site, the model was further calibrated so the time interval and peak flows for predicted and observed hydrographs were similar.
The model was further calibrated to simulate the nutrient loading at the monitoring sites. The water samples collected at each monitoring site were used for determination of nutrient concentration. The nutrient loading for each particular rain event was calculated by multiplying the nutrient concentration by the rain event flow volume. The model was calibrated for nutrient loading by adjusting the scale factor for each water quality parameter within the particle file (NURP50.PAR) until the model predicted nutrient loading estimates similar to observed conditions. In addition, the average nutrient concentration predicted by the model for each water quality parameter was compared to the observed concentrations for each monitoring site.

After the model was calibrated to observed conditions, the model was used to determine the nutrient loading removal efficiency of the three-cell NURP pond and wetland treatment devices. The nutrient removal efficiency was calculated for each water quality parameter for precipitation condition in 2005. The nutrient removal efficiencies estimated by the model were compared to the observed nutrient removal efficiencies determined through monitoring efforts. The model was re-run with a rainfall file that represents average precipitation conditions for the Minneapolis, Minnesota area. The nutrient loading and removal efficiency of the three-cell NURP pond and wetland treatment device was estimated for these average precipitation conditions.
Modeling efforts were further used to determine whether a single-cell NURP pond would be more efficient at removing nutrients in comparison to the existing three-cell NURP pond configuration. The three-cell NURP pond was converted to a single-cell NURP pond with similar morphological characteristics (Table 3). The model was re-run using the precipitation conditions in 2005 and average precipitation conditions to predict the nutrient removal efficiency of the single-cell NURP pond. The nutrient removal efficiencies predicted from the model simulation was compared between the single-cell NURP pond and the three-cell NURP pond.

Results and Discussion
The monitoring data collected at each of the sampling sites were critical for calibrating the P8 model. The model was calibrated using 2005 data collected from May through November because it provided the most complete data set of the study period. During the monitoring interval, the tipping bucket rain gauge recorded 21.8 inches of precipitation in 2005. There were 27 individual precipitation events that produced sufficient run-off volume for sample collection. A total of 67 water quality samples were collected from the three monitoring sites. Although water quality samples were not collected for each precipitation event, the samples were representative of the rainfall distribution with respect to the amount and intensity of precipitation observed in 2005. The total number of samples collected was similar for each monitoring site. There were 20 samples collected at the TP1 monitoring site, and there were 22 samples collected at the TP2 monitoring site. The TP3 monitoring site had more samples collected (25 samples) in comparison to the other sites monitored because of differences in the hydrologic flow regime. The flow and nutrient concentration data collected from these monitoring sites were used for calibration of the P8 model.
The model was initially calibrated to mimic the observed flow conditions during the sampling interval. Unfortunately, only two of the monitoring stations (TP1 & TP3) provided reliable flow information that could be used for model calibration. The TP2 monitoring site did not provide reliable flow measurements because the outlet weir structure was constantly obstructed with debris that inhibited drainage of the three-celled treatment pond into the wetland complex. The obstructions inhibiting flow at the TP2 sampling site did not appear to significantly affect upstream flow measurements due to the available storage capacity of the three-cell treatment pond. In addition, the TP1 sampling site was located far enough upstream of the three-cell treatment pond inlet to minimize any potential backwater effects. Consequently, the model was initially calibrated with flow data collected from the TP 1 monitoring site.
After calibration of the model with the TP1 flow data, the model was re-calibrated using the flow measurements from the TP3 monitoring site. The model was difficult to calibrate using the TP3 data because obstructions from the TP2 monitoring site delayed the drainage of run-off volume that flows downstream of the three-cell treatment pond into the wetland. In addition, there was additional groundwater inflow that occurred between the wetland and the TP 3 sampling site. These groundwater sources of inflow for the TP3 monitoring site were unexpected. Consequently, the monitored flow volume for TP3 included a significant amount of groundwater that needed to be accounted for in the total flow volume calculations. The groundwater flow volume was calculated for each event by identifying the portion of the hydrograph that contributed to groundwater flow volume. The portion of the hydrograph that represented groundwater volume was based on existing flow volumes prior to and after the storm event. In order to calibrate the model for the TP3 monitoring site, the ground water measurements had to be subtracted from the total flow volume during periods with reliable flow measurements. Unfortunately, the TP3 flow measurements were not considered reliable after June due to probe drift. Thus the model was calibrated for the TP3 sampling site using adjusted flow volumes from May through June in 2005.
Despite complications with calibrating the model for the observed flow conditions, the model appears to predict reasonable estimates of flow volume (Table 1). The model predicted that there was approximately 54.5 acre-ft of total flow volume for the TP1 monitoring site. The estimated flow volume was very similar to the measured flow volume of 58.5 acre-ft. In addition, the estimated flow volume for the TP3 monitoring site was also similar to observed monitoring conditions from May through June in 2005. The model predicted there was 12.5 acre-ft of total flow volume for the TP3 monitoring site. After groundwater was subtracted from the total flow volume, there was approximately 14.4 acre-ft of total flow volume measured for the TP3 monitoring site. Although these estimates are calculated from May through June, it appears that the model predicted a reasonable total flow volume for the entire sampling period. The model predicted that there was approximately 39.6 acre-ft of total flow volume for the TP3 monitoring site. Unfortunately, the TP2 monitoring site did not provide reliable flow data to compare to modeled flow volumes. Although there was insufficient flow data for model comparisons, the model appeared to provide a reasonable estimate of flow volume (63 acre-ft) for the TP2 monitoring site.

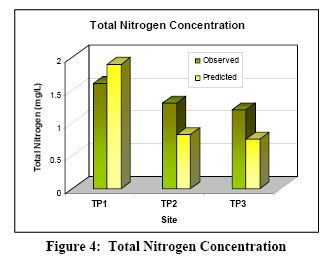
After the model was calibrated for flow volume, the model was further adjusted to mimic the observed nutrient loading conditions. Typically, the scale factors for each water quality parameter were adjusted accordingly until the model predicted nutrient loading and concentrations similar to observed conditions. The model provided reasonable estimates of nutrient loading and/or nutrient concentrations that were similar to measured conditions at the TP1 and TP2 monitoring sites (Tables 3-5). However, the model appeared to underestimate the amount of nutrient loading at the TP3 site. The disparity between observed and predicted nutrient loading estimates is due to differences in nutrient concentration.


The observed nutrient concentrations are substantially higher than those estimated by the model (Figures 3-5). These discrepancies suggest that the wetland does not appear to be a treatment device, but appears to provide a source of nutrients downstream to Pike Lake. Consequently, it becomes difficult to calibrate the model for nutrient loading at the TP3 monitoring site because the model treats the wetland as a sedimentation device that removes nutrients.

The estimates for total flow volume and nutrient loading were used to determine the removal efficiencies of the three-cell NURP pond treatment device. The model suggested that each cell of the three-cell NURP pond was effective at reducing nutrient loading (Table 5). The model estimated that the first cell (Pond 1) provided approximately 47% removal efficiency for total phosphorus, 40% removal efficiency for total nitrogen, and 77% removal efficiency for total suspended solids. The nutrient removal for the second cell (Pond 2) and third cell (Pond 3) was considerably less. The model estimated for Pond 2 that there was approximately 26% removal efficiency for total phosphorus, 20% removal efficiency for total nitrogen, and 59% removal efficiency for total suspended solids. The model estimated for Pond 3 that there was approximately 20% removal efficiency for total phosphorus, 15% removal efficiency for total nitrogen, and 66% removal efficiency for total suspended solids. Similar nutrient removal efficiencies were predicted when the model was re-run for average precipitation conditions (Table 6).

The estimated removal efficiencies for each cell of the three-cell NURP pond appear to be reasonable. The model predicts removal efficiencies based upon the distribution of particle settling velocities in relation to the hydraulic characteristics of the treatment device. Typically, the highest removal efficiencies in a three-cell NURP pond occur within the first-cell because the majority of the sediment particles become filtered as settling velocities decreases. The second and third ponds provide additional treatment at a reduced efficiency since the ponds are considerably less effective at removing fine sediment particles. Despite the differences in removal efficiencies between ponds, the three-cell NURP pond design appears to provide adequate treatment for the Bass Creek Business Park.
It has been speculated that a three-cell NURP pond treatment system provides better nutrient removal than a single-cell NURP pond that has similar morphological characteristics. The model was applied to predict the differences in nutrient removal efficiencies for each best management scenario. Model simulations suggest that the single-cell NURP pond wasn’t quite as effective at reducing nutrient loading in comparison to the three-cell NURP pond (Table 7). These differences did not appear to be very significant when comparing the total phosphorus and total nitrogen loading for each treatment device. However, these differences became more apparent when comparing total suspended solid loading. The model simulation suggests that the single-cell NURP pond was not quite as efficient at reducing total suspended solids in comparison to the three-cell NURP pond. The model produced similar results after re-running the simulation with average precipitation conditions (Table 8). Consequently, the model suggests that the three-cell NURP pond appears to provide somewhat better nutrient removal efficiency in comparison to the single-cell NURP pond.


The P8 model indicates that the three-cell NURP pond treatment device substantially reduced the nutrient loading to the wetland. However, it appears that the wetland provides a primary source of nutrients to Pike Lake. The difficulty in calibrating the model to the observed conditions for the TP3 monitoring site indicates that the wetland does not conform to the anticipated standards that are necessary to classify the basin as a treatment device. The monitoring data indicate that the observed total phosphorus loading and concentrations draining out of the wetland are substantially higher than the observed loading and concentrations entering the wetland (Table 9). Unfortunately, the wetland potentially off-sets any nutrient removal benefits that the three-cell NURP pond may provide. Based on the morphological characteristics of the wetland, the model suggests that the wetland should provide an additional 40% removal efficiency for total phosphorus, 38% removal efficiency for total nitrogen, and 77% removal efficiency for total suspended solids (Table 10). Consequently, the model indicates that the wetland appears to have the potential to significantly reduce the amount of nutrient loading. This is contradictory to the observed monitoring data that was collected for the wetland. The disparity between observed and modeled conditions indicates that preliminary modeling effort may not be suitable to adequately determine the impacts alternative best management practices may have on the proposed change in land use. It might be necessary to monitor existing conditions prior to selecting best management practices to adequately reduce nutrient loading and run-off volume.


Conclusions
A stormwater treatment train composed of a three-cell detention pond and a wetland at Bass Creek Business Park in City of Plymouth, Minnesota, was monitored during 2004-2005 season. The P8 model was calibrated using the flow volumes and nutrient loadings obtained from the monitoring program and used to simulate the performances of different pond configurations under the same condition of runoff. The runoff volume and nutrient removal efficiency of the three-cell pond simulated by the P8 model were well matched with measured data. The simulation results suggested that multiple-cell pond configuration can provide higher removal efficiency in nutrients and suspended solids than can single pond configuration with similar morphological conditions. The P8 model was a useful tool to determine the design configuration of a detention pond to maximize the pollutant removal efficiency for a given site and weather conditions.
The overall efficiency of the treatment train including the wetland was also simulated and compared to the measured data. The simulated nitrogen and phosphorous concentrations and loadings discharged from the wetland were significantly lower than the measured data, overestimating the performance of the wetland at removing nutrients. Monitoring data showed a negative pollutant removal efficiency of the wetland, suggesting that the wetland provides a primary source of nutrient to the receiving water body (i.e., Pike Lake). Because the pollutant removal mechanism in a wetland could not effectively be simulated simply using the sedimentation theory adapted by P8 model, it might be also necessary to monitor existing conditions prior to selecting best management practices to adequately reduce nutrient loading and run-off volume.
Return to Case Studies.