
Data Analysis for Monitoring
A.J. Erickson, P.T. Weiss, J.S. Gulliver, R.M. Hozalski
Monitoring (level 4) is used to assess stormwater treatment practice performance within a watershed for natural storm events in which the influent and effluent discharge and pollutant concentrations are not controlled and therefore vary with time. “Urban Stormwater BMP Performance Monitoring” (U.S. EPA 2002) discusses ten methods for assessing performance from monitoring assessment data and recommends the effluent probability method. In addition to effluent probability, two other methods from U.S. EPA (2002) are described here: (1) summation of load, and (2) event mean concentration efficiency. The fourth method described in this section is the exceedance method. Most monitoring studies (e.g., Anderson et al. 1985, Kovacic et al. 2000, Winer 2000, Lin and Terry 2003, Silvan et al. 2004, Bell et al. undated) report pollutant removal or retention efficiencies based on EMC, but current (e.g., TMDLs) or future regulations may require retention calculations to be based on pollutant load reductions. Reporting data using the effluent probability and exceedance methods will become more common as practitioners become more familiar with them.
Both summation of load and event mean concentration efficiency methods can be used to analyze data for a single storm event (discussed in analysis of individual storm events) or for multiple storm events (analysis of long-term performance) if all water and pollutant import and export locations are accurately sampled or estimated. For more information, see Water Budget Measurement and Sampling Methods. While the effluent probability and exceedance methods can also be applied to single storm event data, the strength of these methods is apparent when applied to data from several storm events in analysis of long-term performance.
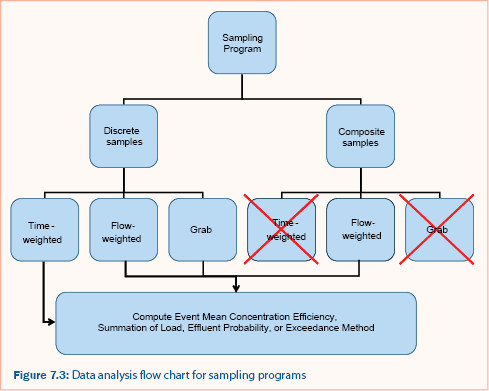
As discussed in Sampling Methods, there are several methods for collecting and storing stormwater samples. The organizational flow for the rest of this section, Monitoring, is shown in figure 7.3.
Continue to Assessment of volume reduction.