A.J. Erickson, P.T. Weiss, J.S. Gulliver, R.M. Hozalski
Synthetic runoff testing (level 3) can be used to measure stormwater treatment practice effectiveness for runoff volume reduction, retention time, and pollutant removal. When performing synthetic runoff testing to assess volume reduction or retention time of stormwater treatment practices, the most important criterion is often whether the stormwater treatment practice can drain or infiltrate the design storm volume in the required time, which is usually 48 hours (Minnesota Stormwater Manual). The next several sections discuss estimating the time required for a filtration practice to drain a specified volume of runoff (i.e., retention time), estimating the drain time of infiltration practices (i.e., volume reduction), and assessment of pollutant removal using synthetic runoff testing.
Assessment of retention time for filtration practices
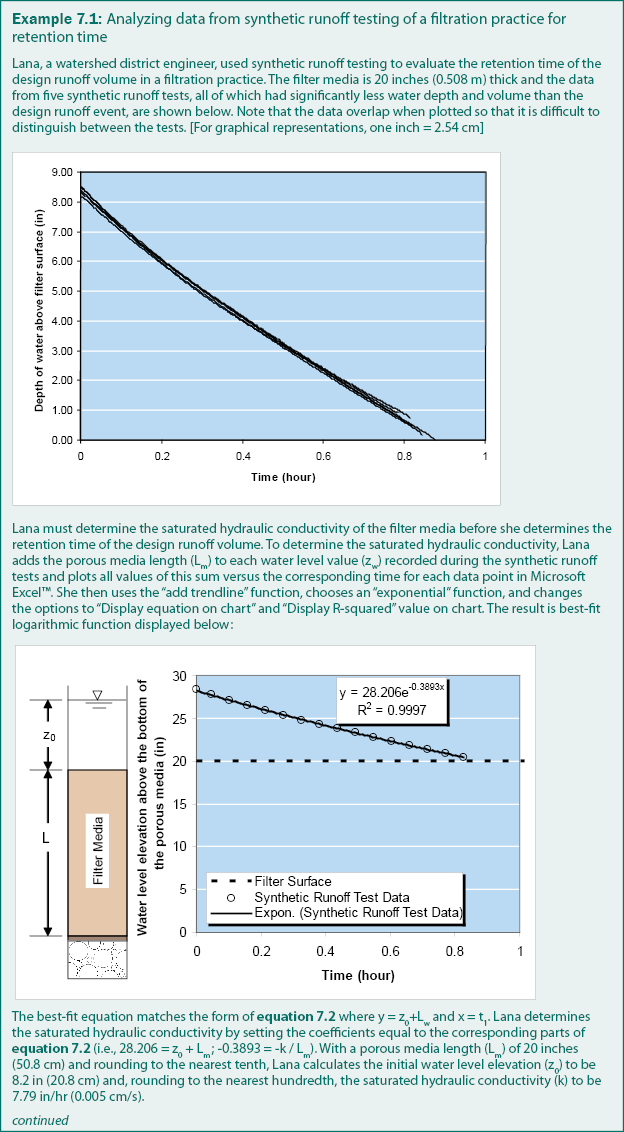
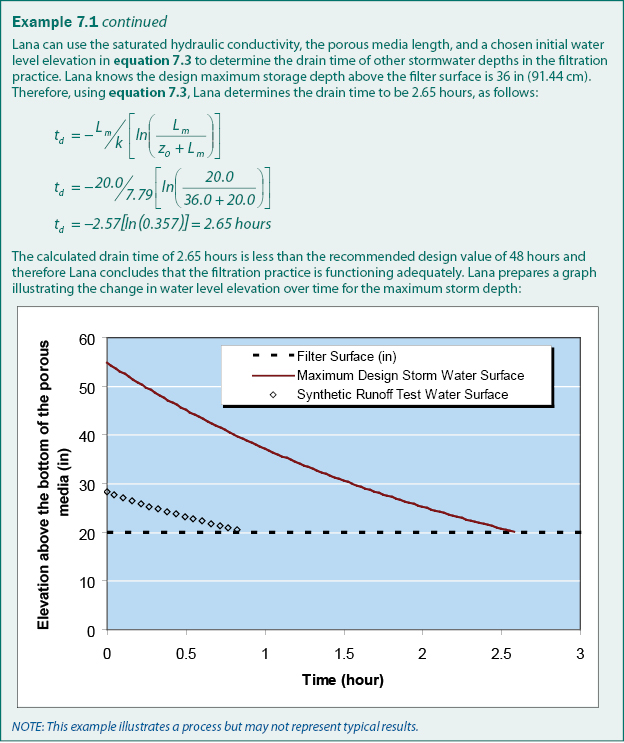
The assessment of a filtration practice for retention time determines if the practice can drain the design storm volume within the design time (e.g., 48 hours). Water flow through a filter can be modeled with Darcy’s Law (equation 7.1), which describes one–dimensional flow through porous media. In the case of a sand filter that is assessed using synthetic runoff testing, equation 7.1 can be integrated after making some assumptions (see Advanced Discussion below) to yield equation 7.2. Equation 7.2 can be fit to synthetic runoff testing data to determine the saturated hydraulic conductivity of the filter media. Then rearranging equation 7.2 to solve for time (t1), the saturated hydraulic conductivity can be used in equation 7.3 to estimate the amount of time (td) required for a filtration practice to drain a specific depth of stormwater runoff (e.g., the design storm). An example of this process is given in example 7.1.


The first assumption for applying Darcy’s Law to filtration practices is that both the surface of the stormwater stored above the filtration practice and the subsurface pipe collection system below the filter media, including the gravel sub-base, are exposed to the atmosphere and therefore at atmospheric pressure. This assumption is valid in most filtration practices. Therefore, with an arbitrary datum of z = 0 at the bottom of the filter media, the piezometric head (h) at the filter surface at any point in time is equal to the water level above the filter surface (zw) plus the length of the porous media (Lm) and varies with time. As a result, the hydraulic gradient across the filter media at any given time is dh/dl = (zw + Lm)/Lm.
The second assumption is that the filter surface area is equally filtering stormwater in one and only one dimension (i.e., vertically downward). For most filtration practices, stormwater will only flow in one dimension unless a layer within a portion of the media is restricting flow. If the second assumption is valid, the total discharge, Q, through the filter is equal to the surface area of the filter (A) multiplied by the change in water level with respect to time (dzw/dt). Substituting this relationship (Q = A(dzw/dt)) and the previously developed equation for hydraulic gradient through the porous media (dh/dL = (zw + Lm)/Lm) into equation 7.1 and cancelling the area (A) terms results in equation 7.4. Rearranging equation 7.4 in preparation for integration results in equation 7.5.


The third assumption is that the length of the porous media (Lm) and saturated hydraulic conductivity (k) are constant with respect to both time (t) and water level elevation (zw). The depth of the filter bed media (Lm) is a physical property of the filtration practice that is based on the design and construction of the practice and is therefore a constant. The saturated hydraulic conductivity (k) is a property of the porous media and the fluid that is passing through the porous media. For homogenous synthetic runoff and non-dynamic porous media, saturated hydraulic conductivity can be assumed to be constant. Therefore, integration of equation 7.5 results in equation 7.2.
As previously discussed, equation 7.2 can be used to determine the saturated hydraulic conductivity of the porous media in a filtration practice. The time required for a filtration practice to drain a specific depth (z0 – zw) of stormwater runoff can be determined by solving equation 7.2 for time (t), and the total drain time can be determined by setting the final water level equal to zero (zw = 0), which results in equation 7.3
Assessment of volume reduction for infiltration practices
Stormwater infiltrating into an infiltration practice is more challenging to model than a filtration practice because the length of the filter media is an unknown variable and the piezometric head gradient (i.e., dh/dl) cannot be easily represented with a single equation. In fact, most infiltration practices cannot be modeled accurately without performing a three-dimensional numerical analysis, which is beyond the scope of this manual. Alternatively, the time required to drain the design runoff volume in an infiltration practice can be estimated by filling the practice with the design storm volume and recording the drain time directly.
If the design storm volume is unknown, or the infiltration practice infiltrates the design storm in less than 48 hours, the actual runoff volume that the practice can infiltrate in 48 hours (i.e., the capacity) must be determined. To determine the capacity using synthetic runoff testing, increase the synthetic runoff volume added to the practice in subsequent tests until the practice cannot drain the volume in 48 hours. Allow time after storm events and between tests for the practice to drain and the soils to adequately dry, similar to natural rainfall events (approximately 2 – 10 days). The measured maximum volume that will drain in 48 hours is the capacity of the practice and the rainfall depth that would generate this volume is the capacity precipitation depth. If the maximum volume provided by the synthetic runoff source (e.g., fire hydrant) infiltrates in less than 48 hours, the actual capacity of the practice is unknown but greater than the capacity provided by the synthetic runoff source.
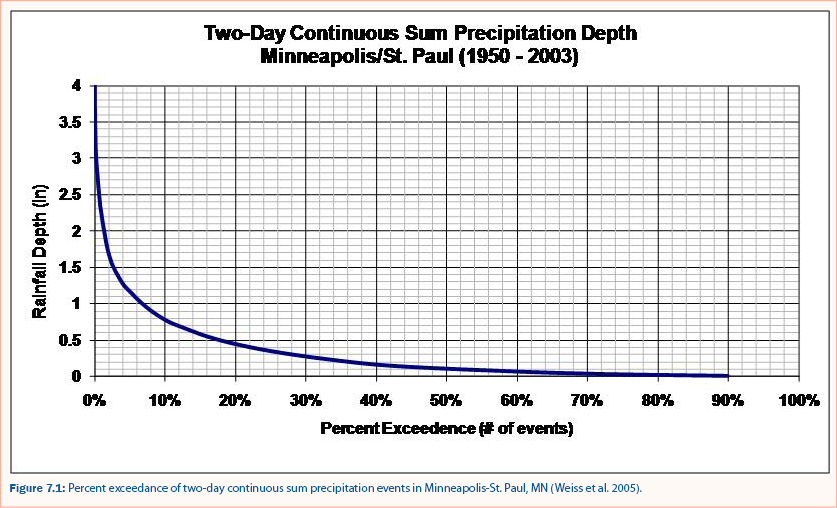
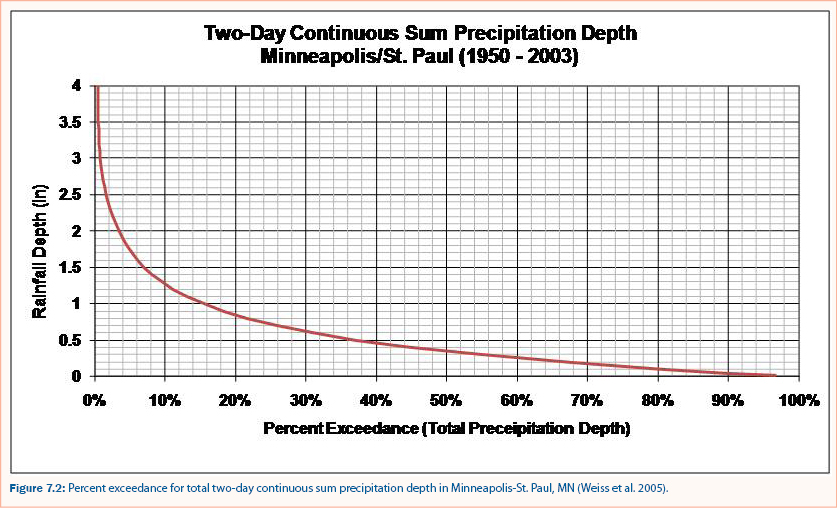
To estimate the long-term volume reduction for an infiltration practice, the capacity precipitation depth must be compared to local precipitation exceedance frequencies. For example, the exceedance frequency for two-day continuous sum precipitation events in Minneapolis-St. Paul, MN is shown in figure 7.1 and the percent captured for total two-day continuous sum precipitation depth is shown in figure 7.2. If the capacity volume for an infiltration practice is generated by a rainfall depth of 0.5 inches, the percent of storm events that exceed the capacity of the practice is approximately 18% (figure 7.1) and thus approximately 82% (100% - 18%) of storm events are completely captured by the infiltration practice.
The total volume reduction, however, includes both the total volume of storms completely captured by the practice and the portion of larger storms that is captured before overflow. For example, if the design storm depth for an infiltration practice is 0.5 inches, the volume reduction is the summation of all storm events less than or equal to 0.5 inches in depth plus the first 0.5 inches of depth from all storms larger than 0.5 inches. This is the percent of total precipitation depth captured by the infiltration practice and is equivalent to the percent volume reduction. For a design storm depth of 0.5 inches, the percent exceedance for total precipitation depth is approximately 38% (figure 7.2) and thus 62% of the total rainfall volume is captured and treated within the infiltration practice (i.e., volume reduction = 62%).
Assessment of pollutant removal
Synthetic runoff tests are a recent technique for assessment of pollutant removal by a stormwater treatment practice (Wilson et al. 2007; Asleson et al. 2007) but examples of synthetic runoff testing are provided in Case Studies. In one of those examples (Case Study #2), sediment load reduction was determined for an underground sedimentation practice by measuring the amount of sediment captured by the device compared to the total amount of sediment that entered the device. The effectiveness of the device was then determined by an application of equation 7.6.

Alternatively, the influent and effluent runoff volume and pollutant concentrations can be measured and the pollutant removal effectiveness is estimated using equations 7.7 and 7.8.


Continue to Monitoring.