A.J. Erickson, J.S. Gulliver, R.M. Hozalski, P.T. Weiss
Process
Filtration is the process of removing suspended solids from the stormwater by passing the water through a bed of porous media consisting of sand or soil. In filtration, the solids that are removed from the water are retained by the filter media. The primary retention mechanism is sieving, where solids that are larger than the pore spaces in the sand or soil structure are captured and retained as the stormwater passes through the filter media. Solid deposition or attachment onto filter media or previously deposited solids is another possible solid retention mechanism in filters.
For the same head (i.e., depth of water), the filtration rate is greater for filter media with large pore spaces (i.e., large grain size such as gravel) than for filter media with small pore spaces (i.e., small grain size such as sand or silt). Filter media with large pores, however, allow larger solids, and subsequently more solids, to pass through the filter, which reduces solids removal efficiency. Therefore, designing a filtration practice is a balance between filtration rate and solid removal efficiency. While there are currently no effluent or performance regulations other than TMDLs (Total Maximum Daily Loads), the Minnesota Stormwater Manual states that the design storm runoff volume should be able to pass through a filtration practice within 48 hours of a storm event. Additional guidance on filtration practice design and installation can also be found in the Minnesota Stormwater Manual.
Dissolved pollutants may also be retained by adsorption onto filter media and previously deposited solids or by chemical precipitation reactions within the filter media. Removal of dissolved pollutants such as phosphorus, however, is typically minimal for standard sand filters. Harper and Herr (1993) reported that pilot-scale and full-scale sand filters retained 40–50% particulate phosphorus, but only 5% dissolved phosphorus. Similarly, Herrera Environmental Consultants (1995) reported that typical sand filter media had little capacity (0–28% total, 0–38% dissolved) for phosphorus retention. On the other hand, dissolved phosphorous removal can be significantly enhanced if the sand is amended with iron, calcium, aluminum, or magnesium (Arias et al. 2001). Steel wool improved phosphorus retention capacity of ASTM standard C33 sand by 25% to 99% in pilot-scale stormwater filters (Erickson et al. 2007). Other amendments, such as peat and compost, can have the opposite effect by releasing nutrients as stormwater passes through the filter and subsequently increasing the load of nutrients downstream (Erickson et al. 2007).
Practices
Surface sand or soil filters
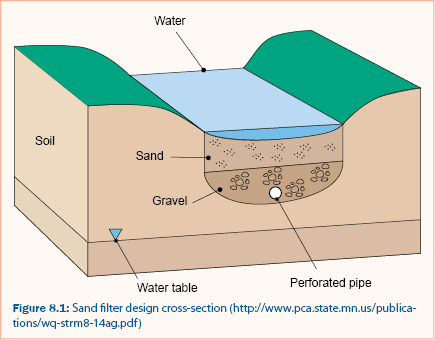
Surface sand or soil filters (sometimes called “Austin sand filters”) have a filter mechanism typically made up of a layer of filter media (18–24 inches, 46–61 cm). The filter media is separated from a gravel bed by a layer of geotextile fabric that prevents the filter media from washing through to the gravel bed. The gravel bed contains a perforated pipe collection system that captures filtered stormwater and delivers it either downstream for additional stormwater treatment or directly to receiving waters. These systems are installed in depressions (Claytor and Schueler 1996) as shown in figure 8.1.
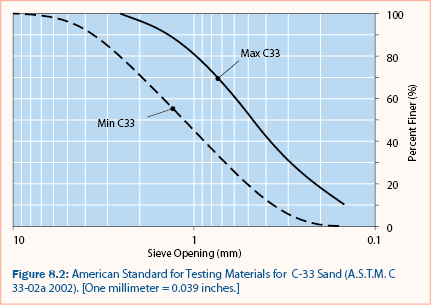
The filter media consists of native soils or locally or commercially available sands selected and sieved specifically to meet filtration specifications. Using native soil as the filter media reduces the overall cost of a filtration practice, but the grain size distribution of native soils is often not appropriate for stormwater filtration (i.e., will not pass the design storm within 48 hours or will not retain sufficient amount of solids). Standard concrete sand (A.S.T.M. 2002) that has a particle size distribution as shown in figure 8.2, is a recommended filtration medium that is readily available (Claytor and Schueler 1996). The Minnesota Stormwater Manual can also provide guidance on selecting filter media.
The surface area typically prescribed for a surface sand filter is 3.0% or less of the total watershed impervious area (U.S. EPA 1999). Weiss et al. (2007) reported that on average (± 67% confidence interval), sand (not soil) filters in the United States retain 82% (± 14%) of total suspended solids and 46% (± 21%) of total phosphorus. The U.S. EPA (U.S. EPA. 1999) reported typical ranges of 50%–80% for total suspended solids and 50%–80% for total phosphorus in surface sand filters.
Underground sand or soil filters
Underground sand or soil filters (sometimes called “Delaware sand filters”) consist of a chamber in which stormwater runoff is collected, routed underneath a baffle wall, and directed over a weir. The baffle wall retains floatable pollutants, and the weir creates a pool that allows large dense solids to settle. Once over the weir, stormwater passes through a filter media bed that can capture additional suspended solids. Like surface filters, filter media for underground sand or soil filters consist of native soils or locally or commercially available sands selected and sieved specifically for filtration purposes. Underground sand or soil filters are typically constructed on site or purchased prefabricated from commercial vendors. Some manufacturers produce underground filtration systems and underground sedimentation devices (see Sedimentation Practices).
An advantage of underground sand or soil filters is that they usually do not require surface land area because the entire practice is underground. They may not, however, have the hydraulic capacity of surface filters if subsurface space is limited. Even if the hydraulic capacity is lower, a properly designed underground filter is expected to perform similarly to a surface filter with regard to total suspended solids and total phosphorus retention. Thus, the values reported by Weiss, et al. (2007) and U.S. EPA (1999) for surface sand filters that were discussed above also apply to underground filters.
Frequency of use
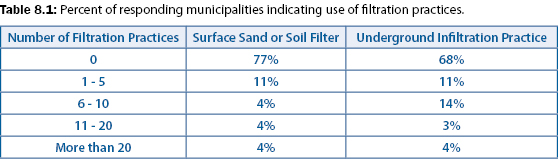
A survey (Erickson et al. 2009) designed to collect information related to stormwater treatment practice use in Minnesota and Wisconsin revealed that most municipalities do not use filtration practices as a part of their stormwater management plan. As shown in Table 8.1, 77% and 68% of responding municipalities did not use any surface sand filters or underground filters, respectively. Eleven percent of the municipalities used 1 to 5 such devices and the percentage of the municipalities using more than 5 was also relatively small. Detailed survey results are given in Table 8.1, which shows the percentages of responding municipalities that indicated the use of filtration treatment practices by number of filtration devices within their jurisdiction.
Assessment
There are 4 levels of assessment for stormwater treatment practices: visual inspection, capacity testing, synthetic runoff testing, and monitoring. Determining which levels of assessment should be used in an assessment program for filtration practices will depend on two considerations in addition to those discussed in Developing an Assessment Program: size of the practice and pollutant removal goals (i.e., suspended solids only or suspended solids and dissolved pollutants).
Visual inspection (level 1) and capacity testing (level 2) do not depend on the size of the stormwater treatment practice and therefore can be applied to any filtration practice as long as the conditions in Developing an Assessment Program are met. The applicability of synthetic runoff testing (level 3), however, is dependent on the size of the filtration practice and the available water supply. Monitoring filtration practices is only limited by the site design and accessibility of the practice. See Water Budget Measurement and Sampling Methods for information on flow measurement and sampling locations required for monitoring stormwater treatment practices, including filtration practices.
One goal for the assessment of filtration practices may be to quantify solids removal efficiency, which is commonly measured as the percent reduction between sediment mass load entering and exiting the practice. Visual inspection (level 1) cannot be used to quantify the removal of solids but can provide visual indications that solids are captured. Capacity testing (level 2) for sediment retention are not applicable to filtration practices because some solids may be retained within the filter media and not on the surface. Therefore, synthetic runoff testing (level 3) or monitoring (level 4) is required to determine the efficiency of a filtration practice with regards to the removal of solids. The removal of dissolved pollutants can be assessed in conjunction with the suspended solids removal assessment. The results of assessment can indicate whether a filtration practice is clogged or has macropores as discussed in the following paragraphs. Discussion and recommendations for applying each of the four levels to filtration practices is provided in the following sections.
Continue to Visual Inspection.